摘要:[WPF] DynamicDataDisplay _ To hide LineGraph by clicking legenditem
藉由點擊Legend Item隱藏Chart中的曲線,應該是很常見的應用
今天WPF中, 我採用了DynamicDataDisplay這個由Microsoft Reserch提供的open source來做chart應用
它本身的功能很強大, 應該也是目前有zoom in/ zoom out的 free source
不過每個人的需求不同, 就必須自行擴充囉...
是這樣的, 要能支援點擊Legend Item隱藏Chart曲線
我修改了幾個重點如下
1. 很基本的新增Legend的點擊事件著手
並且完成後要e.Handled = true; 中止事件流, 以防止操作上的不順與怪怪
plotter.Legend.MouseLeftButtonDown += Legend_MouseLeftButtonDown;
void Legend_MouseLeftButtonDown(object sender, MouseButtonEventArgs e)
{
    if (e.Source is LegendItem)
    {
        //lineGraph.Visibility處理
        e.Handled = true;
    }
}
2. MouseNavigation class中我修改了OnPlotterAttached & OnPlotterDetaching, 目的是希望Legend的滑鼠事件比OnMouseDown更觸發
public override void OnPlotterAttached(Plotter plotter)
{
	base.OnPlotterAttached(plotter);

	/*Mouse.AddPreviewMouseDownHandler(Parent, OnMouseDown);    //modify by Me
	Mouse.AddPreviewMouseMoveHandler(Parent, OnMouseMove);
	Mouse.AddPreviewMouseUpHandler(Parent, OnMouseUp);
	Mouse.AddPreviewMouseWheelHandler(Parent, OnMouseWheel);*/

        Mouse.AddMouseDownHandler(Parent, OnMouseDown);
        Mouse.AddMouseMoveHandler(Parent, OnMouseMove);
        Mouse.AddMouseUpHandler(Parent, OnMouseUp);
        Mouse.AddMouseWheelHandler(Parent, OnMouseWheel);
}
3. 在Legend類別中, 我在AddLegendItem中加入legendItem.Tag = stackPanel.Children.Count;
藉此判斷哪個item被點擊, 哪個linegraph應該隱藏/開啟
public void AddLegendItem(LegendItem legendItem)
{
     legendItem.Tag = stackPanel.Children.Count; //add by Me
     stackPanel.Children.Add(legendItem);
     UpdateVisibility();
}
結果如下
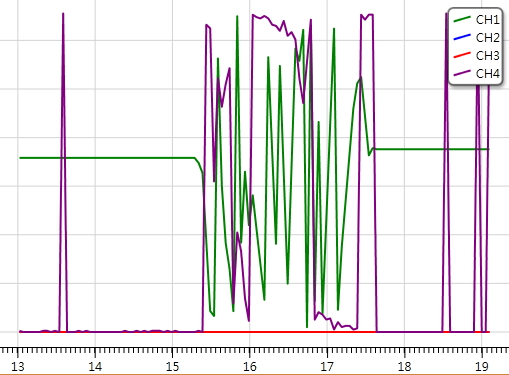
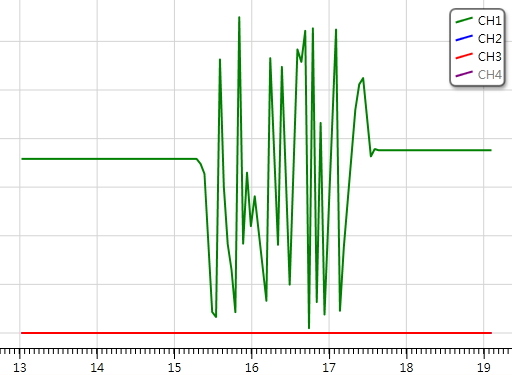
有任何問題或建議, 歡迎提出:)
