LinkedIn幫Kafka做了很多吞吐量效能測試,他們以RabbitMQ benchmark為範本來進行一連串的效能測試,
單一producer、100 bytes、3x async-replication每秒高達75MB(每秒可發送786432 的message),
sync-replication約40MB(每秒可發送419430的message)。單一Consumer則每秒有89.7MB(每秒可接收940573的message),
三個Consumer約為249.5MB(每秒可接收2616197.12的message),
而End to End的Producer’s latency平均2 ms,一整個讓我驚艷。
Kafka system tools有提供Producer和Consumer的效能測試工作,
但這些工具我覺得有點老王賣瓜,我建議你實際使用.net client進行測試比較貼近真實世界,
話雖如此,這些資料我認為還是有參考價值,我使用VM並透過內建工具,
簡單進行producer's Latency和consumer's throughput效能測試,主要可以知道幾個參數影響。
VM環境
Kafka 版本:0.10.2.0
OS:windows 2016
CPU:2.3G x2 core
RAM:4G
NIC: 1GB/s
Producer
壓縮測試= none、gzip、snappy
kafka-producer-perf-test.bat --num-records 100000 --record-size 100 --topic rico-topic --throughput 1000 --producer-props bootstrap.servers=192.168.137.182:9092,192.168.137.182:9093,192.168.137.182:9094,192.168.137.182:9095 max.in.flight.requests.per.connection=5 batch.size=100 compression.type=none
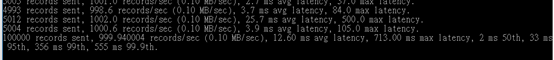
compression.type :none 、總筆數:100000、資料大小:100 bytes、吞吐量:1000、batch size:100、factor:2
Result: 100000 records sent, 999.940004 records/sec (0.10 MB/sec), 12.60 ms avg latency, 713.00 ms max latency, 2 ms 50th, 33 ms 95th, 356 ms 99th, 555 ms 99.9th.
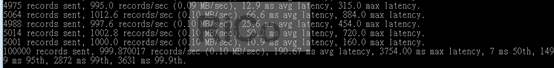
compression.type=gzip
Result: 100000 records sent, 999.870017 records/sec (0.10 MB/sec), 190.67 ms avg latency, 3754.00 ms max latency, 7 ms 50th, 1499 ms 95th, 2872 ms 99th, 3631 ms 99.9th
compression.type= snappy
Result: 100000 records sent, 999.960002 records/sec (0.10 MB/sec), 1755.34 ms avg latency, 16627.00 ms max latency, 2 ms 50th, 10893 ms 95th, 15640 ms 99th, 16564 ms 99.9th.
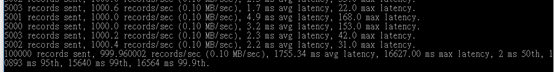
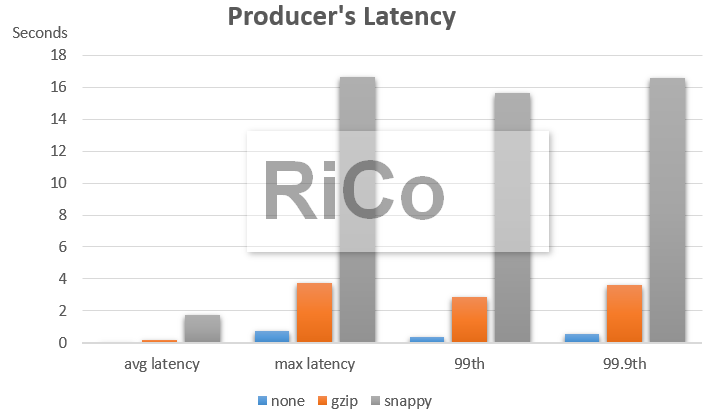 可以看到小資料使用壓縮的效益不大,反而還增加latency,所以小資料不壓縮可減少Producer的latency。
批次大小測試=1,10,100
kafka-producer-perf-test.bat --num-records 100000 --record-size 100 --topic rico-topic --throughput 20000 --producer-props bootstrap.servers=192.168.137.182:9092,192.168.137.182:9093,192.168.137.182:9094,192.168.137.182:9095 max.in.flight.requests.per.connection=5 batch.size=1 compression.type=none
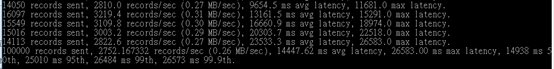
batch.size=1
Result: 100000 records sent, 2752.167332 records/sec (0.26 MB/sec), 14447.62 ms avg latency, 26583.00 ms max latency, 14938 ms 50th, 25010 ms 95th, 26484 ms 99th, 26573 ms 99.9th
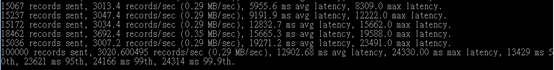
batch.size=10
Result: 100000 records sent, 3020.600495 records/sec (0.29 MB/sec), 12902.68 ms avg latency, 24330.00 ms max latency, 13429 ms 50th, 23621 ms 95th, 24166 ms 99th, 24314 ms 99.9th
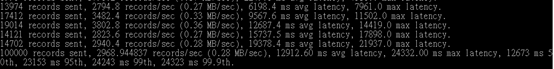
batch.size=100
Result:100000 records sent, 2968.944837 records/sec (0.28 MB/sec), 12912.60 ms avg latency, 24332.00 ms max latency, 12673 ms 50th, 23153 ms 95th, 24243 ms 99th, 24323 ms 99.9th.
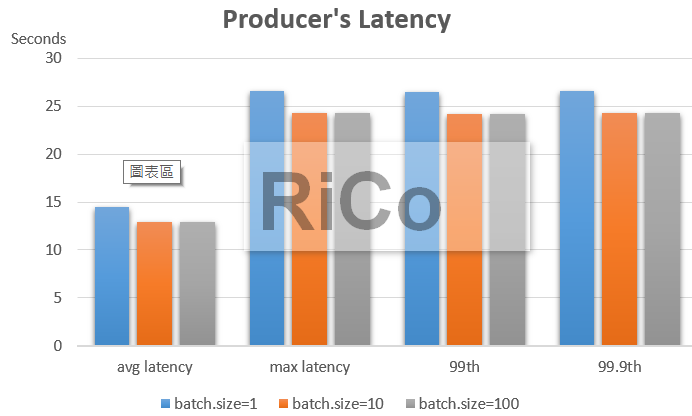 Batch.size=1沒想到latency反而還比較高,看樣子batch.szie=100應該是LinkedIn覺得可以符合大多數環境的基準值。
資料大小測試=100、512、1024
kafka-producer-perf-test.bat --num-records 100000 --record-size 100 --topic rico-topic --throughput 10000 --producer-props bootstrap.servers=192.168.137.182:9092,192.168.137.182:9093,192.168.137.182:9094,192.168.137.182:9095 max.in.flight.requests.per.connection=5 batch.size=100 compression.type=none
record-size=100
Result: 100000 records sent, 2629.088232 records/sec (0.25 MB/sec), 16754.08 ms avg latency, 28088.00 ms max latency, 17178 ms 50th, 27806 ms 95th, 28048 ms 99th, 28081 ms 99.9th.
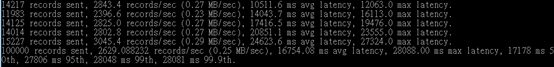
record-size=512
Result: 100000 records sent, 2568.779059 records/sec (1.25 MB/sec), 14022.88 ms avg latency, 25766.00 ms max latency, 12542 ms 50th, 24845 ms 95th, 25515 ms 99th, 25735 ms 99.9th
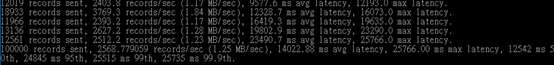
record-size=1024
Result: 100000 records sent, 2393.375138 records/sec (2.34 MB/sec), 10780.28 ms avg latency, 18085.00 ms max latency, 10845 ms 50th, 17201 ms 95th, 17819 ms 99th, 18065 ms 99.9th.
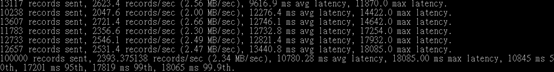
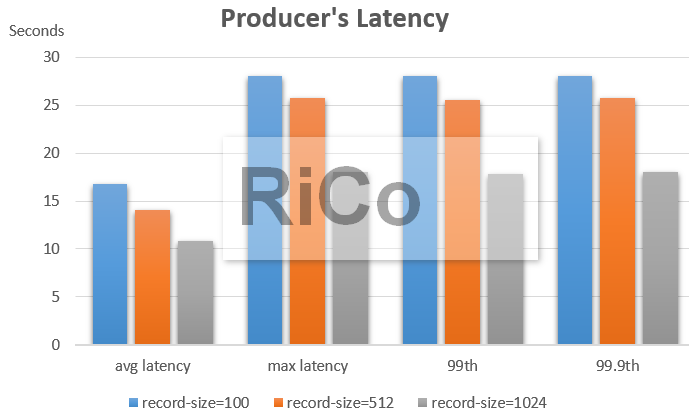 資料大小算主要影響Producer的效能。
Consumer
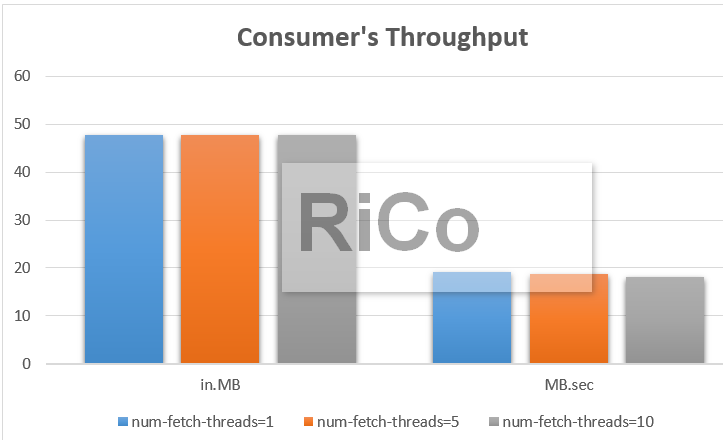
num-fetch-threads=1、5、10
kafka-consumer-perf-test.bat --batch-size 500 --messages 500000 --broker-list=192.168.137.182:9092,192.168.137.182:9093,192.168.137.182:9094,192.168.137.182:9095 --topic rico-topic --group rico-topic-group --new-consumer --num-fetch-threads 1
num-fetch-threads=1
Result: 2017-10-29 03:47:25:444, 2017-10-29 03:47:27:933, 47.7219, 19.1731, 500400, 201044.5962
![]()
num-fetch-threads=5
Result: 2017-10-29 03:49:15:756, 2017-10-29 03:49:18:310, 47.7219, 18.6851, 500400, 195927.9561
![]()
num-fetch-threads=10
Result: 2017-10-29 03:50:07:855, 2017-10-29 03:50:10:495, 47.6909, 18.0647, 500075, 189422.3485
![]()
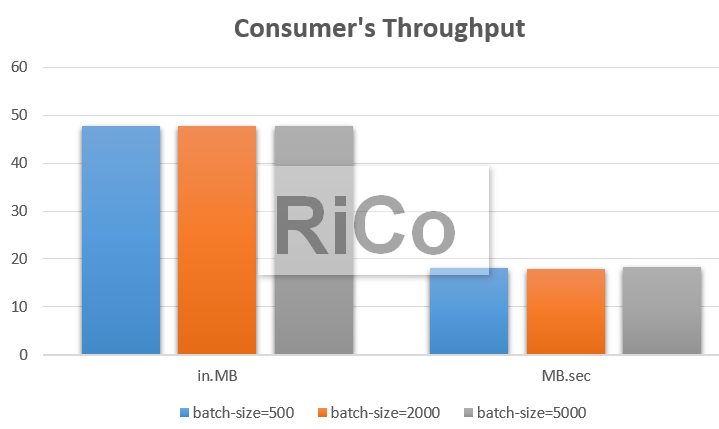
batch-size=500、2000、5000
batch-size=500
Result: 2017-10-29 03:54:00:090, 2017-10-29 03:54:02:728, 47.7219, 18.0902, 500400, 189689.1585
![]()
batch-size=2000
Result: 2017-10-29 03:55:02:275, 2017-10-29 03:55:04:935, 47.7219, 17.9405, 500400, 188120.3008
![]()
batch-size=5000
Result: 2017-10-29 03:55:35:240, 2017-10-29 03:55:37:844, 47.6993, 18.3177, 500163, 192074.8848
![]()
進行Kafka performance tunning,一定要記得使用自己的.net Client來測試比較準確。
參考
Benchmarking Apache Kafka: 2 Million Writes Per Second (On Three Cheap Machines)
Benchmarking Message Queue Latency