我想有在玩資料分析的朋友對於jupyter一定不陌生,它是一款open source的網頁版Machine Learning Analytics tools,
透過這套工具,你可以快速又方便進行資料分析、跑跑演算法,實作視覺化,而他也是iPython的前身,
至於切分出該專案,主要是因為iPython想更專注在shell的核心開發(shell真的很強大),
所以把其他元件都往Jupyter 專案集中,但我想我應該會喜歡web介面。
Jupyter是一個介於IDE和Editor的工具,我們可以用它來寫直譯語言,同時很容易做到資料視覺化,
並且可以輸出成HTML5崁入到任何網頁上,也可顯示多媒體資源(圖片、影片和LaTeX)和執行javascript,
或是用notebook格式分享並討論,很多資料分析、Machine Learning的平台上的討論,
大部分都是以Jupyter notebook的格式出現,且支援多種主流直譯語言,
Python,R,Julia、Scala....等超過40種語言,安裝上也相當簡單方便。
python3 -m pip install --upgrade pip
python3 -m pip install jupyter
你可透過以下命令設定password
jupyter notebook --generate-config
jupyter notebook password
但我都在本機,所以直接jupyter notebook --ip=0.0.0.0 --port=8888 --allow-root
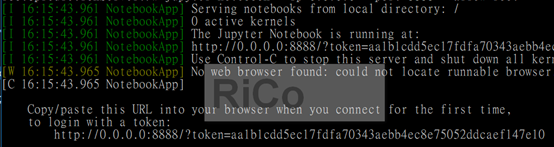
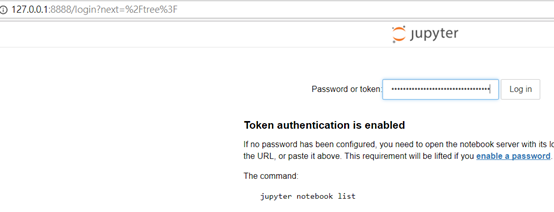
開啟127.0.0.1:8888 並輸入token登入
 我們先來換一下黑底,寫程式我想大家都會愛黑底主題,
可以先去jupyter-themes逛逛(記得pip install --upgrade notebook)。
pip3 install --upgrade jupyterthemes
jt -t oceans16 -fs 95 -altp -tfs 12 -nfs 115 -cellw 88% -T
ps:記得重新啟動
匯出之前的電影資料
pio export --appid 1 --output /tmp/movies --format parquet
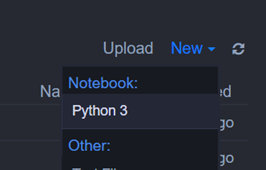
New 一個python3
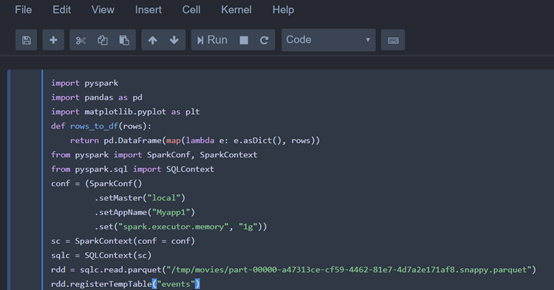
 輸入以下python,建立一個events的temp table(記得先pip install pyspark、pip install pandas)
import pyspark
import pandas as pd
import matplotlib.pyplot as plt
def rows_to_df(rows):
    return pd.DataFrame(map(lambda e: e.asDict(), rows))
from pyspark import SparkConf, SparkContext
from pyspark.sql import SQLContext
conf = (SparkConf()
         .setMaster("local")
         .setAppName("Myapp1")
         .set("spark.executor.memory", "1g"))
sc = SparkContext(conf = conf)
sqlc = SQLContext(sc)
rdd = sqlc.read.parquet("/tmp/movies/part-00000-a47313ce-cf59-4462-81e7-4d7a2e171af8.snappy.parquet")
rdd.registerTempTable("events")
 我常用的快捷鍵
Shift + tab:看函式的說明
Esc+h:列出所有快捷鍵
Esc + d,d:刪除目前cell
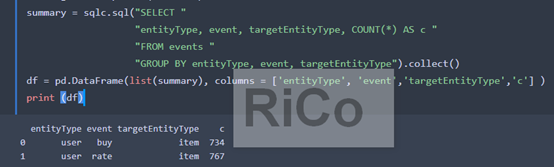
接下來透過spark sql進行資料分析並輸出結果(spark sql讓我太有親切感了~XD)
summary = sqlc.sql("SELECT "
                   "entityType, event, targetEntityType, COUNT(*) AS c "
                   "FROM events "
                   "GROUP BY entityType, event, targetEntityType").collect()
df = pd.DataFrame(list(summary), columns = ['entityType', 'event','targetEntityType','c'] )
print (df)
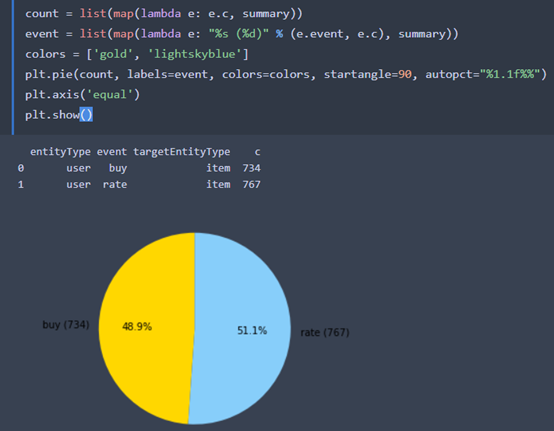
視覺化的第一步都是圓餅圖
count = list(map(lambda e: e.c, summary))
event = list(map(lambda e: "%s (%d)" % (e.event, e.c), summary))
colors = ['gold', 'lightskyblue']
plt.pie(count, labels=event, colors=colors, startangle=90, autopct="%1.1f%%")
plt.axis('equal')
plt.show()
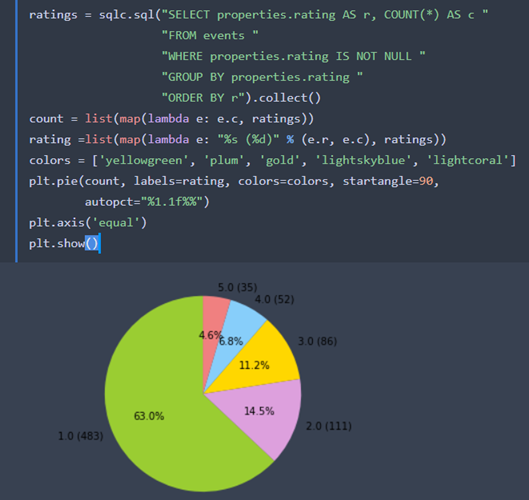
接下來,我們繼續分析rating的分佈情況
ratings = sqlc.sql("SELECT properties.rating AS r, COUNT(*) AS c "
                   "FROM events "
                   "WHERE properties.rating IS NOT NULL "
                   "GROUP BY properties.rating "
                   "ORDER BY r").collect()
count = list(map(lambda e: e.c, ratings))
rating =list(map(lambda e: "%s (%d)" % (e.r, e.c), ratings))
colors = ['yellowgreen', 'plum', 'gold', 'lightskyblue', 'lightcoral']
plt.pie(count, labels=rating, colors=colors, startangle=90,
        autopct="%1.1f%%")
plt.axis('equal')
plt.show()
 人客~~這樣有沒有很簡單,另外,直譯式語言真的好懂又簡單上手
參考
Machine Learning Analytics with IPython Notebook
https://nbviewer.jupyter.org/