我們將使用HAProxy當我們的Load-Balaning,雖然沒有L4/L7來的猛,但CP值絕對是讓人滿意的
HAproxy我就不多作介紹,這篇我將先設定web server和sql server的Load-Balancing,
以及簡單的效能調校
install HAproxy 1.8 on CentOS 7
sudo wget http://www.haproxy.org/download/1.8/src/haproxy-1.8.7.tar.gz
sudo tar zxvf haproxy-1.8.7.tar.gz
sudo rm -rf haproxy-1.8.7.tar.gz
cd haproxy-1.8.7
sudo make TARGET=linux2628 ARCH=x86_64 PREFIX=/usr/local/haproxy
sudo make install PREFIX=/usr/local/haproxy
sudo cp -R /opt/haproxy-1.8.7/examples/errorfiles /usr/local/haproxy/
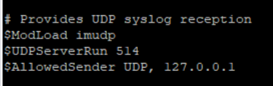
sudo vi /etc/rsyslog.conf
$ModLoad imudp
$UDPServerRun 514
$AllowedSender UDP, 127.0.0.1
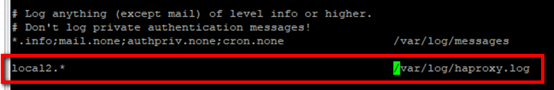
local2.* /var/log/haproxy.log
sudo systemctl restart rsyslog

sudo vi /usr/local/haproxy/conf/haproxy.cfg
global
    log 127.0.0.1 local2 info
    chroot /usr/local/haproxy
    pidfile /var/run/haproxy.pid
    maxconn 4096
    #user haproxy
    #group haproxy
    daemon
	stats timeout 2m
    nbproc 1

defaults
    mode http
    log global
    option httplog
    option dontlognull
    option http-server-close
    option forwardfor except 127.0.0.0/8
    option redispatch
    retries 3
    timeout http-request 10s
    timeout queue 1m
    timeout connect 10s
    timeout client 1m
    timeout server 1m
    timeout http-keep-alive 10s
    timeout check 10s
    maxconn 51200

# stats UI
listen stats
    mode http
    bind 0.0.0.0:1080
	maxconn 10
    stats enable
	stats refresh 10s
	stats uri /haproxystats
    stats hide-version
    stats realm Haproxy\ Statistics
    stats auth admin:xxxxx
    bind-process 1
    stats admin if TRUE
	errorfile 400 /usr/local/haproxy/errorfiles/400.http
	errorfile 403 /usr/local/haproxy/errorfiles/403.http
	errorfile 408 /usr/local/haproxy/errorfiles/408.http
	errorfile 500 /usr/local/haproxy/errorfiles/500.http
	errorfile 502 /usr/local/haproxy/errorfiles/502.http
	errorfile 503 /usr/local/haproxy/errorfiles/503.http
	errorfile 504 /usr/local/haproxy/errorfiles/504.http

# http frontend config
frontend http-in
    bind *:80
    mode http
    log global
    option httpclose
    option logasap
    option dontlognull
    capture request header Host len 30
    capture request header Referer len 60
    default_backend httpservers

# http backend config
backend httpservers
    mode http
	option redispatch
    balance static-rr  #roundrobin
    server web1 172.16.79.111:80 weight 1 maxconn 8192 check port 80 inter 2000 rise 2 fall 5
    server web2 172.16.79.112:80 weight 1 maxconn 8192 check port 80 inter 2000 rise 2 fall 5

# mssql frontend config
frontend mssql-in
    bind *:1433
	mode tcp
	log global
	option dontlognull
	default_backend msslqservers

# mssql backend config
backend msslqservers
   mode tcp
   balance static-rr   #leastconn roundrobin
   option log-health-checks
   server mssqldb2 172.16.79.26:1433 weight 1 maxconn 8192 check port 1433 inter 2000 rise 2 fall 3
   server mssqldb3 172.16.79.30:1433 weight 1 maxconn 8192 check port 1433 inter 2000 rise 2 fall 3
udo ln -s /usr/local/haproxy/conf/haproxy.cfg /etc/haproxy/
sudo ln -s /usr/local/haproxy/sbin/haproxy /usr/sbin/haproxy
sudo cp /opt/haproxy-1.8.7/examples/haproxy.init /etc/rc.d/init.d/haproxy
sudo chmod +x /etc/rc.d/init.d/haproxy
sudo chkconfig --add haproxy
sudo chkconfig haproxy on
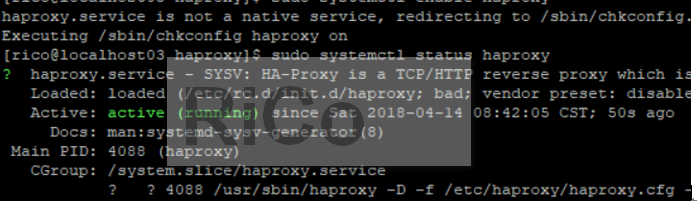
sudo systemctl start haproxy
http://192.168.137.11:1080/haproxystats
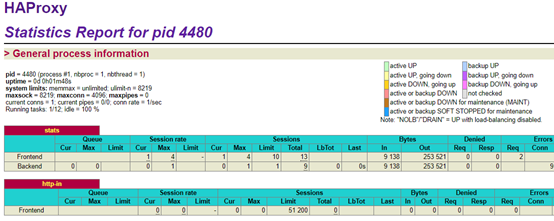 這裡我們就完成了HAProxy的安裝和設定,下面來看看效能調整。
Install ApacheBench tool
我將使用AB來測試
sudo yum provides /usr/bin/ab  # discover which the package container
sudo yum -y install httpd-tools
just running ab to check
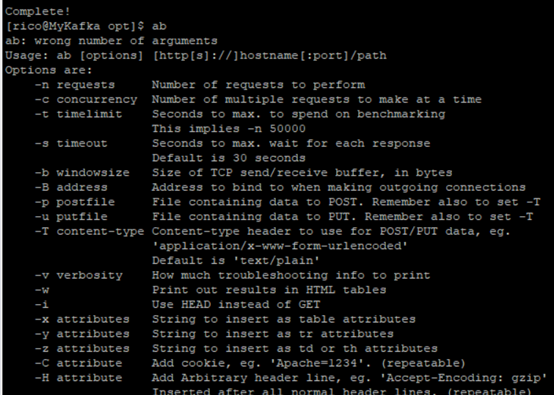
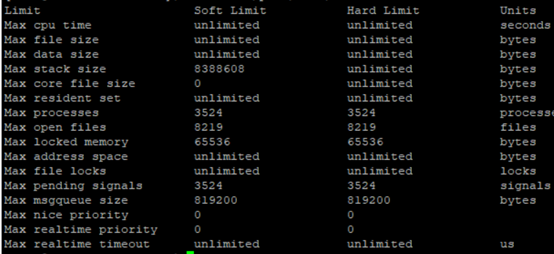
ulimit –a # a way to check number of open files
sudo sh -c "ulimit -n 65535 && exec su $LOGNAME"
ab -c 2500 -n 5000 -s 90 http://192.168.137.11:1080/
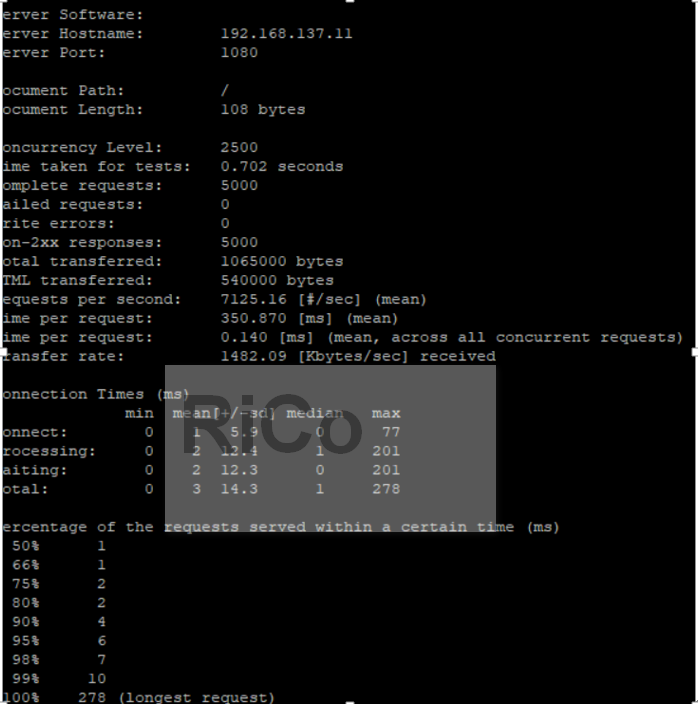
Report text explanation
Document Path: # website 路徑
Document Length: #web page大小
Concurrency Level: #併發數量
Time taken for tests: #整體測試時間
Complete requests: #完成的repuest
Failed requests: #失敗的repuest
Total transferred: #整體網路傳輸量
HTML transferred: #整體HTML傳輸量
Requests per second: 7125.16 [#/sec] (mean) #每秒平均request數量。很重要的指標,類似DB中的每秒交易數量,這是一個平均值
Time per request: 350.870 [ms] (mean) #每一個repqest平均回應時間。很重要的指標,類似DB中的每個交易完成時間,這是一個平均值
Time per request: 0.140 [ms] (mean, across all concurrent requests) #每個repuest連線執行時間的平均值。
Transfer rate: 1482.09 [Kbytes/sec] received #平均每秒網路流量,可幫助確認是否因為流量過大導致response時間過長問題

50%的response低於1 ms,99%的response 低於 10ms,最大的response低於278 ms。
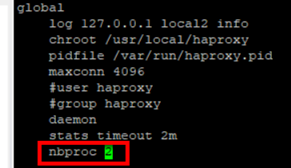
更改nbproc #depends on your cores of cpu
目前我的haproxy設定worker process =1,這裡我將依照CPU數量更改,在使用ab測試一次
AB result
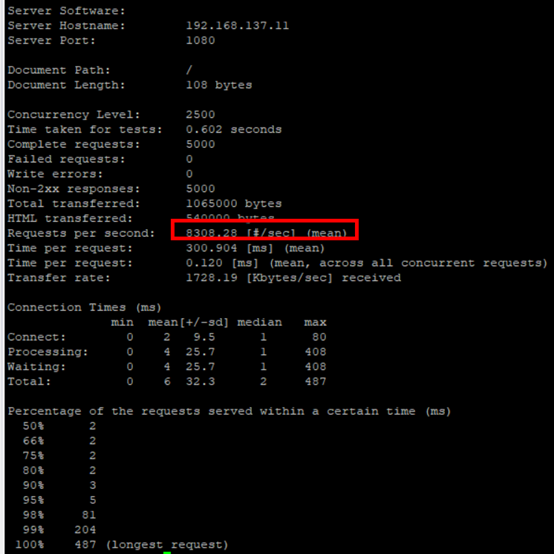 可以看到每秒repuest平均從7125.16提高至8308.28,
一般來說,效能高低會和CPU成線性關係,但也要注意預留一定數量給linux OS,
避免產生反效果,當然還有其他因素也會造成非預期結果,
例如CPU cache命中率不佳。
淺談CPU affinity
一般來說,我們不希望process在CPU之間頻繁遷移,因為遷移的頻率越小,表示所產生的負載越小,
剛好Linux核心的process協調器天生就有這種特性,即CPU affinity(一種 scheduler property)。
預設HAproxy使用一個worker process,如果再SMP(Symmetric Multi-Processing)架構下,
該worker process可能會被分到cpu0或cpu1,這時就會有一個cpu的workload很低,
而且也無法分散所有repuest,所以我們可以起兩個worker process,
那麼worker0 process 將會綁定至cpu0、worker1 process綁定至cpu1,
這樣HAproxy Server才能得到很高的併發效能,也可以避免單一CPU的處理壓力,
同時減少worker process等待cpu時間,另外,CPU的快取當然是越高越好,
如果有多個process都需要存取相同資料,那麼將這些process都綁定到一個CPU是非常有意義的,
因為可以確保都使用相同的cpu data cache(提高命中率),
所以Load-balancing的Server,基本要多CPU、高時脈和高快取(L2或L3)。
Note:由於程式作者一定會比scheduler更了解process,所以我們寫程式可以手動分配至某CPU,
而不要過多占用CPU0,這樣可以讓我們的process不和別的process爭奪CPU0資源,
理論上,可以提高我們程式效率。
![]()
sudo cat /proc/2771/limits # discover which the haproxy’s process #ps aux | grep haproxy
調整負載平衡演算法為 static-rr
static-rr是一個很類似round robin演算法,但因為static-rr不用考慮動態權重問題,
所以演算法效率會高於round robin(約 1 %)
AB result
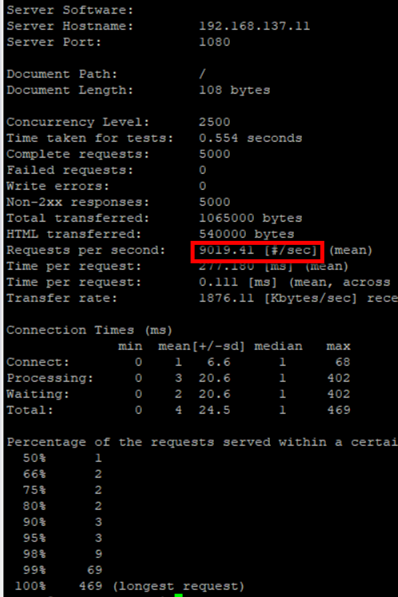 可以看到每秒repuest平均從8308.28再提高至9019.41。
參考
How we fine-tuned HAProxy to achieve 2,000,000 concurrent SSL connections