已經取得資料了,但是這樣的顯示方式很不好閱讀,接著就是要介紹如何順利的結構化這些資料。
本篇將會使用numpy和pandas。
第 12 屆 iT 邦幫忙鐵人賽-原文:https://ithelp.ithome.com.tw/articles/10236488
程式碼
(完成程式碼在本段下方)
首先我們需要安裝numpy和pandas,分別執行:
pipenv install numpy
pipenv install pandas安裝完後,就可以把套件import近來囉:
import numpy
import pandas因為要列印出表格,變成結構化,所以多點資料比較有感覺,這邊就把時間變成timestamp參數:
# API位置
start_time = 1596211200
end_time = 1599926400
address = f"https://query1.finance.yahoo.com/v8/finance/chart/2317.TW?period1={start_time}&period2={end_time}&interval=1d&events=history&=hP2rOschxO0"
然後把取得的資料,變成序列化,也就是用json套件:
# 序列化資料回報
data = json.loads(response.text)然後把資料放入強大的pandas中,就大功告成囉~
# 把json格式資料放入pandas中
df = pandas.DataFrame(
    data["chart"]["result"][0]["indicators"]["quote"][0],
    index=pandas.to_datetime(
        numpy.array(data["chart"]["result"][0]["timestamp"]) * 1000 * 1000 * 1000
    ),
)
最後,把結果印出來,就可以看到囉
# 印出前3行:
print(df[:3])
# 印出前5行
print(df.head())
顯示出的畫面是:
                          open      close       high    volume        low
2020-08-03 01:00:00  78.400002  77.099998  78.900002  61172243  77.099998
2020-08-04 01:00:00  77.699997  78.099998  78.199997  23051382  77.500000
2020-08-05 01:00:00  78.300003  77.900002  78.500000  27876127  77.900002
                          open      close       high    volume        low
2020-08-03 01:00:00  78.400002  77.099998  78.900002  61172243  77.099998
2020-08-04 01:00:00  77.699997  78.099998  78.199997  23051382  77.500000
2020-08-05 01:00:00  78.300003  77.900002  78.500000  27876127  77.900002
2020-08-06 01:00:00  79.300003  79.000000  79.699997  33250505  78.500000
2020-08-07 01:00:00  79.599998  78.300003  79.599998  21862438  78.300003
完整程式碼
import requests
import json
import numpy
import pandas

# API位置
start_time = 1596211200
end_time = 1599926400
address = f"https://query1.finance.yahoo.com/v8/finance/chart/2317.TW?period1={start_time}&period2={end_time}&interval=1d&events=history&=hP2rOschxO0"

# 使用requests 來跟遠端 API server 索取資料
response = requests.get(address)

# 序列化資料回報
data = json.loads(response.text)

# 把json格式資料放入pandas中
df = pandas.DataFrame(
    data["chart"]["result"][0]["indicators"]["quote"][0],
    index=pandas.to_datetime(
        numpy.array(data["chart"]["result"][0]["timestamp"]) * 1000 * 1000 * 1000
    ),
)
# 印出前3行:
print(df[:3])
# 印出前5行
print(df.head())
說明
稍微解說一下,這兩個套件:
- numpy:擁有多維度陣列物件,可以用來儲存資料,也有一些function處理資料。
- pandas:是以
numpy為基礎,提供更豐富的類別,可以用來處理資料。
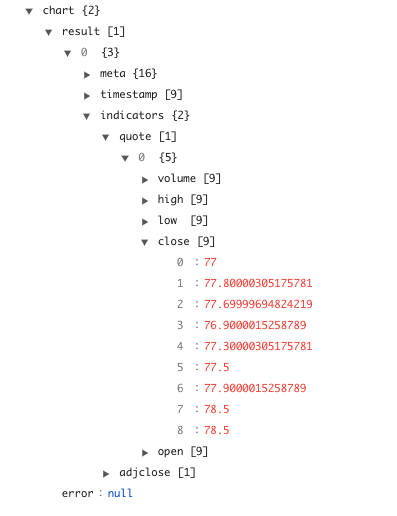
在資料儲存中,這邊使用的是第17行的pandas.DataFrame,他的格式為:DataFrame(資料,index=時間戳),所以依照我們轉成json的資料結構,資料會在data["chart"]["result"][0]["indicators"]["quote"][0],時間戳(timestamp)會在numpy.array(data["chart"]["result"][0]["timestamp"]。詳細的資料結構可以參考下圖:
~Copyright by Eyelash500~
IT技術文章:EY*研究院
iT邦幫忙:eyelash*睫毛
Blog:睫毛*Relax
Facebook:睫毛*Relax
